
May 31, 2021
【研究紹介】商業施設の時空間データを利用した研究(貞広幸雄教授)Analysis of spatiotemporal point data of commercial facilities (Professor SADAHIRO Yukio)
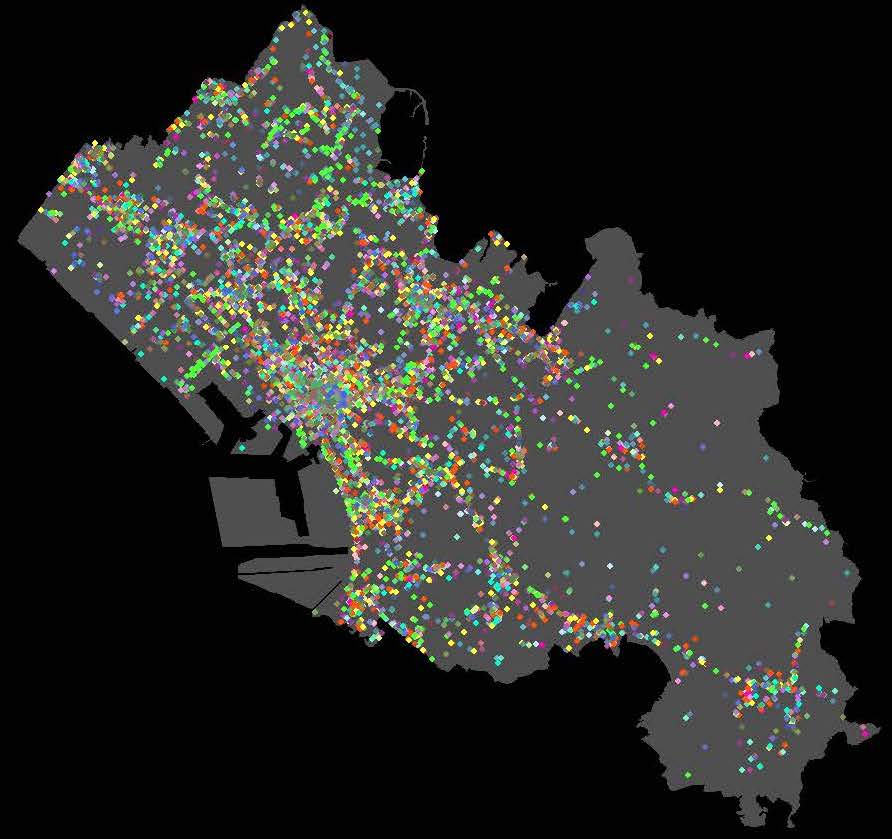
当研究室では近年、図1のような商業施設の時空間データを利用した研究を多く手懸けています。このデータには,1995~2020年の期間に存在した商業施設について、住所、業種、開閉業年月が記録されています。これを住所照合によってポイント・データに変換し、GIS(Geographic Information System:地理情報システム)に取り込むことで地図上に可視化、分析を行うことができます。
このデータを利用した研究の一つに、点の発生・消滅の頻度を統計的に処理して可視化する手法の開発があります。飲食店の半数は開業後2年以内に閉店すると言われており、地域によっては店舗の寿命がさらに短い場合もあります。出退店の頻度を可視化する一つの方法は、店舗数に対する出退店の割合を地域ごとに計算し、図化するというものです。しかしこの方法では、2店舗中1店舗の閉店と、2000店舗中1000店舗の閉店とは同じ割合として扱われます。前者は偶然起こりうることですが、後者は何か大きな問題が生じていることを示唆しています。
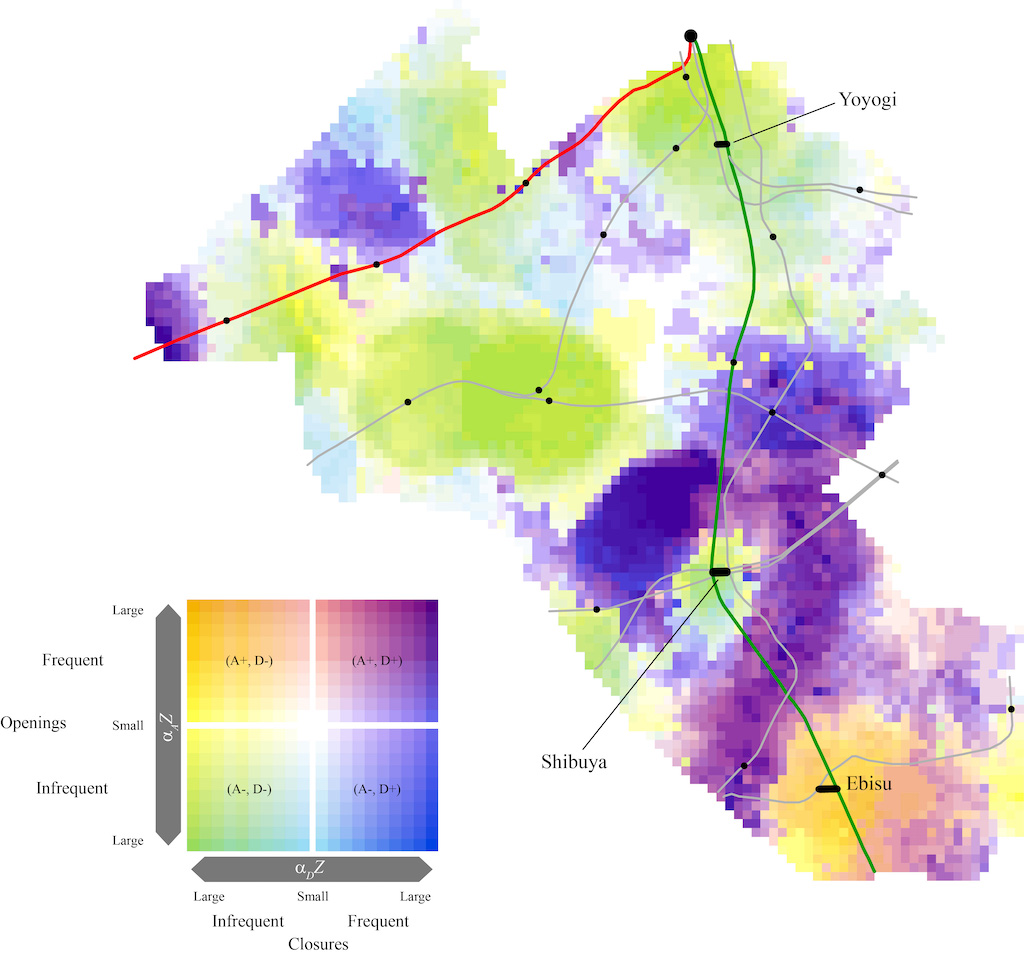
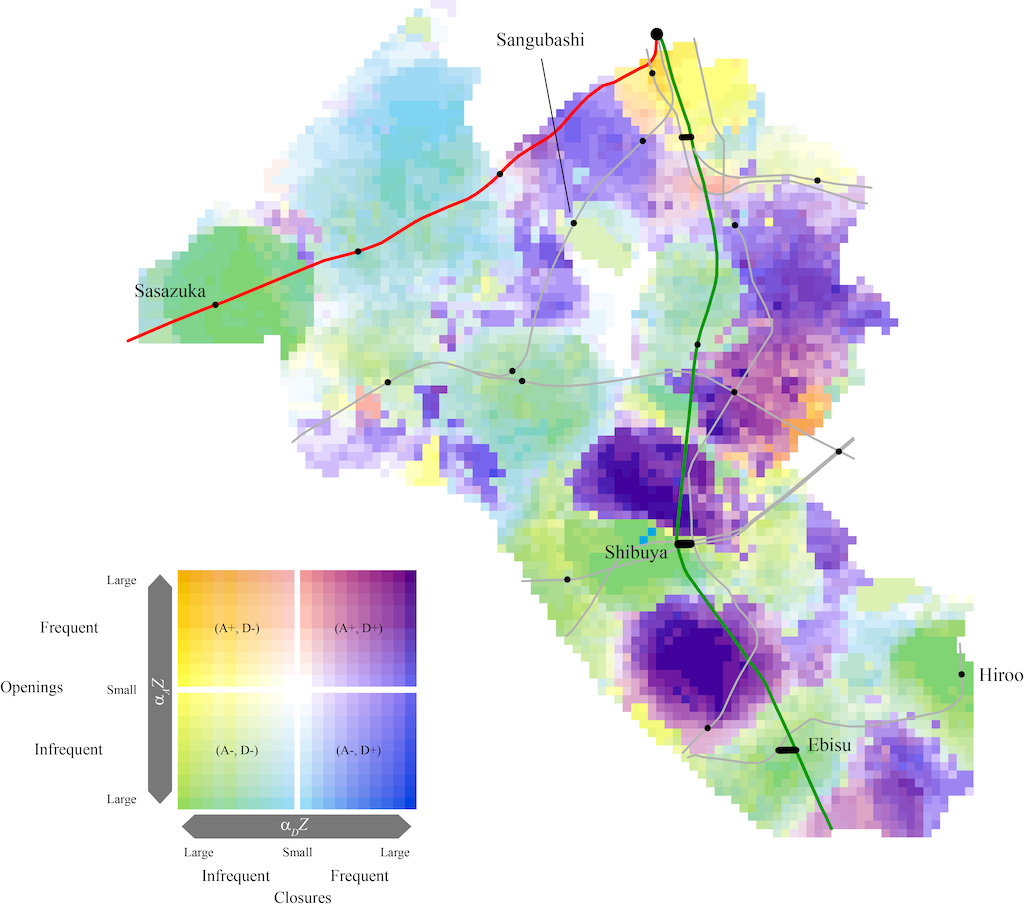
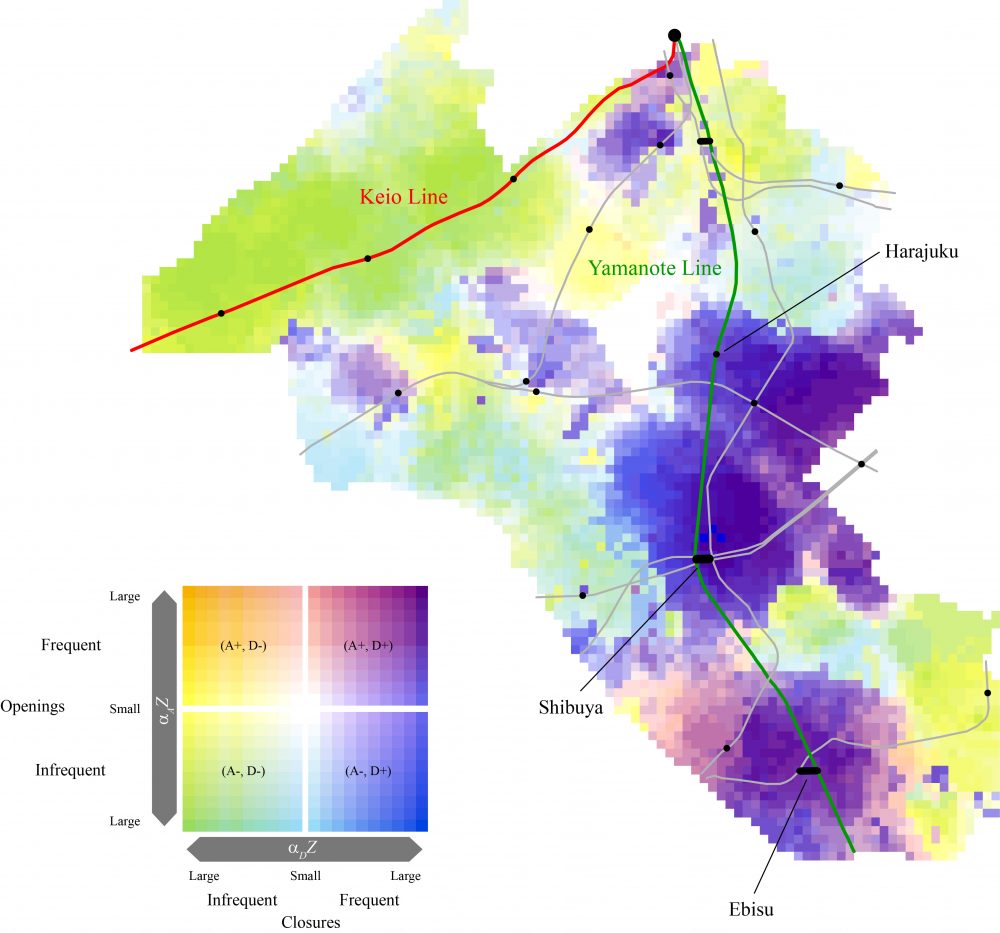
この両者を区別するために、尤度に基づいた新たな指標を提案し、渋谷区の商業施設の出退店について、分析を行いました。図2~4は、渋谷区の衣料品店、飲食店、病院における、出退店の頻度分布を表しています。
紫色 :出退店共に高頻度
黄緑色:出退店共に低頻度
橙色 :出店は高頻度,退店は低頻度
青色 :出店は低頻度,退店は高頻度
図を見ると、例えば渋谷駅周辺では3業種とも出退店の頻度が高く、店舗間の競争が激しいことが分かります。面白いのは、飲食店の出退店の頻度が渋谷駅の直ぐ近くでは低いことです。駅の地下街や今は無き東急東横店のレストランなど、この地域には老舗の飲食店が多く、店舗の入れ替わりが少なかったことを表しています。これらはいずれも、既存手法では明らかにできない現象であり、本研究の有用性を示しております。
上記の例は、商業施設の時空間データを利用した研究の一例です。この種の時空間データは、近年急速に整備されつつありますが、他方、データの活用方法に関する議論は十分とは言えません。いわゆるビッグデータについても同様ですが、データの活用方法の開発が、今後ますます必要とされています。
〈LINKS〉
https://www.tandfonline.com/doi/abs/10.1080/13658816.2018.1538517
https://www.sciencedirect.com/science/article/pii/S0198971518305829
記事:貞広幸雄(教授)
We recently utilized spatiotemporal point data of commercial facilities, such as shown in Figure 1. We have a list of commercial facilities from 1995 to 2020 in Shibuya-ku, Tokyo. Geocoding of the addresses generates spatial point data, which serve as a basis for quantitative spatial analysis in a GIS (Geographic Information System).
One application of the data is to analyze the appearance and disappearance of points over time. The study aims to develop measures for evaluating the frequencies of appearances and disappearances. One possible measure that can serve this purpose is the ratio of events to points calculated in each lattice cell. This measure, however, cannot distinguish between the disappearance of 1 out of 2 points and that of 1000 out of 2000 points. Whereas the former can easily happen by chance, the latter implies the occurrence of a major problem. To resolve this, we developed a new method for analyzing the appearance and disappearance of points. The method is based on the likelihood of appearances and disappearances under a random situation, thus avoiding the problem mentioned above.
We applied the method to the analysis of the openings and closures of commercial facilities in Shibuya-ku. Figures 2-4 show the distributions of the proposed measures calculated for clothing stores, restaurants, and clinics, respectively.
Purple: Frequent openings and closures
Light green: Infrequent openings and closures
Orange: Frequent openings and infrequent closures
Blue: Infrequent openings and frequent closures
Openings and closures are both frequent around Shibuya station in all the figures. Interestingly, openings and closures are infrequent in the immediate vicinity of Shibuya station in Figure 3. This is because many old and traditional restaurants in this area have long-term support from loyal customers. Existing methods cannot provide these findings, thus supporting the effectiveness of the proposed method.
The above is one example of the applications of spatiotemporal point data of commercial facilities. Spatiotemporal point data have rapidly become available due to the development of new data acquisition tools. Analysis of such data, on the other hand, has not yet been discussed extensively. Methods for analyzing spatiotemporal data need to be developed to reveal the underlying structure of spatiotemporal point patterns.
〈LINKS〉
https://www.tandfonline.com/doi/abs/10.1080/13658816.2018.1538517
https://www.sciencedirect.com/science/article/pii/S0198971518305829
Text:Yukio Sadahiro (Professor)
English proofreading:David Buist (Senior project specialist)
主担当教員Associated Faculty Members

教授
貞広 幸雄
- 総合分析情報学コース
Professor
SADAHIRO, Yukio
- Applied computer science course